Screenshots
Icon palette
About this app
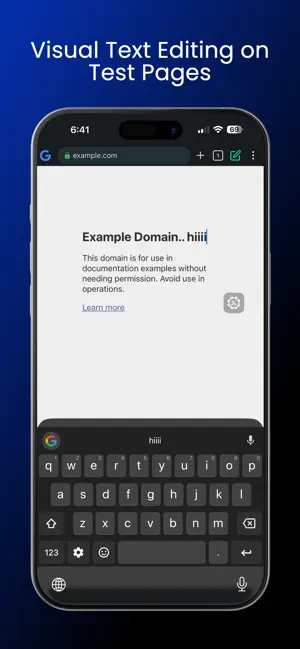
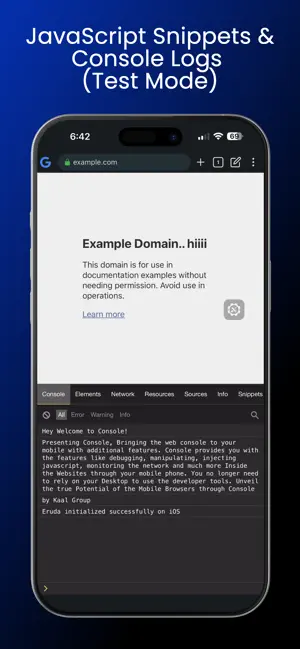
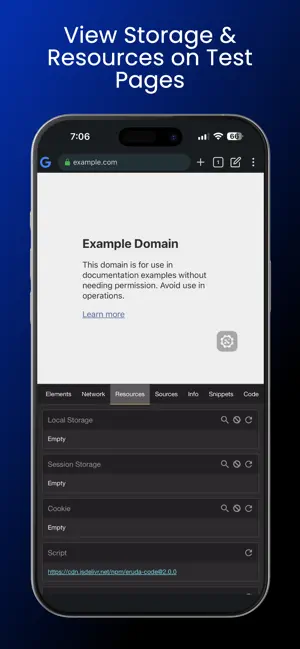
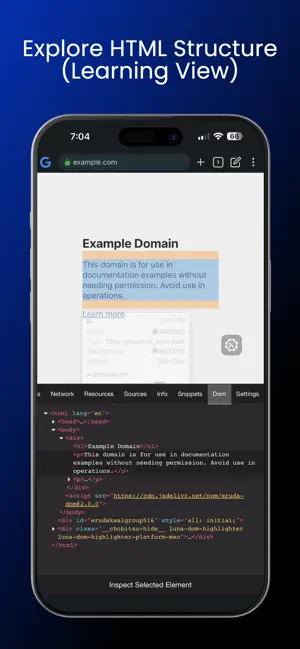
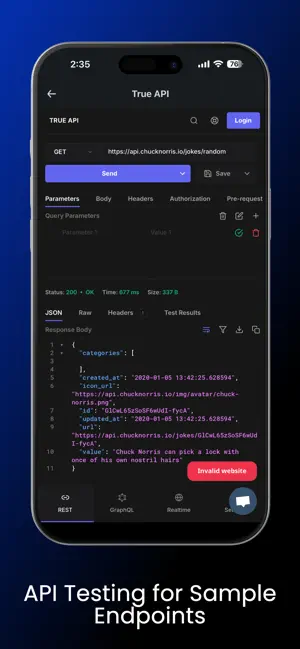
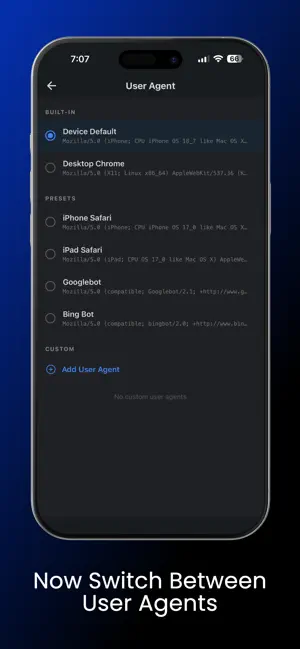
Eruda Browser Console is a lightweight developer utility for learning, testing, and debugging web content inside a controlled in-app browser environment on iOS. Designed for web developers, frontend engineers, QA testers, and learners, the app provides an integrated browser with a built-in developer console for experimenting with JavaScript and inspecting page behaviour during development and testing. Key Features • View console logs (log, warn, error) • Monitor network activity on test pages • Run JavaScript snippets in a sandbox environment • Explore HTML structure and page elements • Monitor performance and FPS during testing • Analyse page resources • Switch between mobile and desktop user agents • Debug your own websites, local servers, and development environments • No external tools or desktop required Built for Developers and Learners Whether you are: • Testing responsive …
App details
What you can learn from Eruda Browser Console
Every shipping app on the App Store has gone through the same decisions you're working through right now: which screenshot goes first, what caption sits over it, which device frame to show, what color the background should be. The 6 screenshots above are Eruda Browser Console's answers to those questions — they're public, they're real, and they made it through Apple's review.
Notice the first screenshot in particular. It's the one users see in search results and on the product page, and it's where most apps spend their best caption and tightest design. Look at the proportion of background to phone, where the text sits, what one thing the image is trying to communicate.
Want to see how other Developer Tools apps approach the same problem? Browse more Developer Tools apps in the showcase.
Take what works into your own screenshots
Open LaunchShots and design your App Store & Google Play screenshots — pick a device frame, drop captions, ship in minutes. Free, in your browser.
Open the screenshot editor →