Google App Campaigns vs Apple Search Ads (2026): Where to Spend
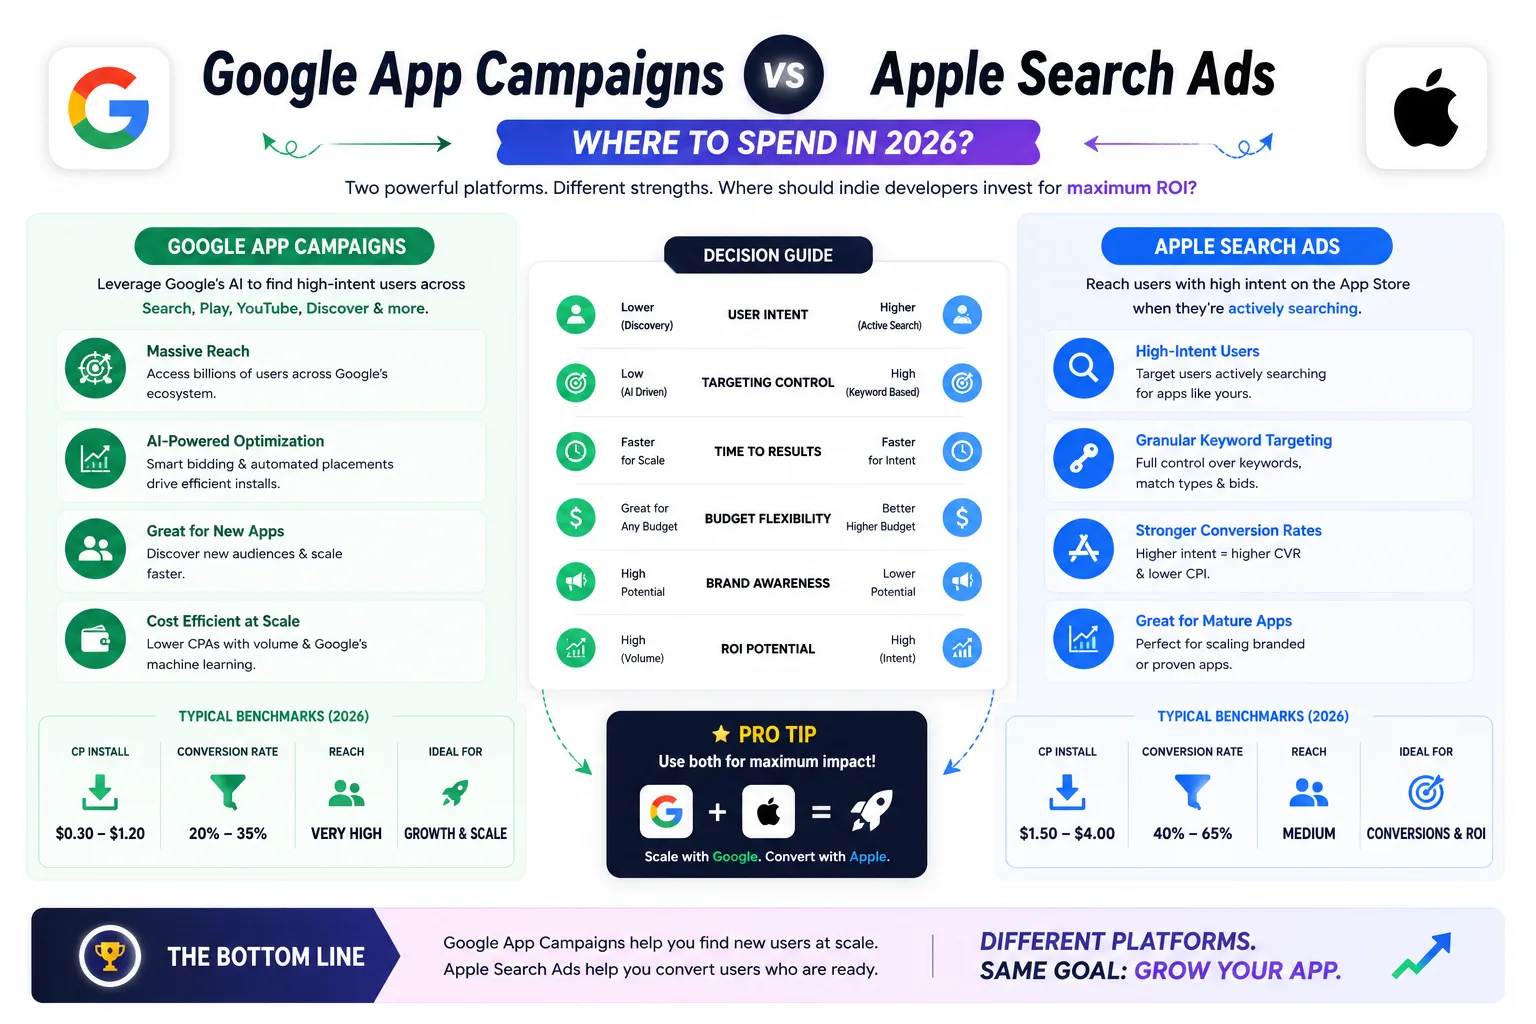
Most indie developers think of paid acquisition as a binary choice: Apple Search Ads or Google App Campaigns. The 2026 data argues the opposite. ASA averages $1.80 CPI; GAC averages $1.29 — but the platform with the lower CPI isn't always the more efficient channel. Apple delivers 67.2% tap-to-install conversion (vs GAC's broader, lower-intent reach). Google scales beyond what App Store search demand supports. Apple gives you native deterministic attribution; Google delivers iOS attribution with 24–72 hour SKAdNetwork delays. Most mature acquisition strategies allocate 60–70% to Apple Search Ads and 30–40% to Google App Campaigns — not because one is better, but because they solve different problems. This is the operator-level guide for indie developers in 2026: the real CPI math by category, where each platform structurally wins, the budget allocation framework that actually works, and the operational mistakes that burn budget on either platform.
What each platform actually is
Both platforms drive paid mobile app installs, but the targeting model and intent profile are fundamentally different:
- Apple Search Ads (ASA): Places sponsored listings at the top of App Store search results, in the Today tab, the Search tab pre-search suggestions, and on competitor product pages. Bid-driven, keyword-matched, iOS-only. Two products: Basic (hands-off, $5 max CPI cap) and Advanced (full keyword control, Custom Product Pages, audience targeting). Attribution is native and deterministic — Apple sees the click, the install, and the conversion path natively.
- Google App Campaigns (GAC): Distributes ads across Google Search, YouTube, AdMob, Google Display Network, Google Play Store, Discover, and Gmail simultaneously. ML-driven, automated targeting, cross-platform (iOS and Android). You supply creative (text headlines, images, video) and a budget; Google's machine learning handles placement and bidding. iOS attribution flows through Firebase + SKAdNetwork; Android attribution is straightforward and near-real-time.
The shorthand: ASA is intent-matched and high-quality; GAC is reach-driven and scalable. ASA reaches users actively searching the App Store; GAC reaches users across Google's entire ecosystem regardless of immediate search intent.
The 2026 CPI benchmarks: where each platform actually sits
Real benchmarks from SplitMetrics, AppsFlyer, AppTweak, and SEM Nexus data across 2026 campaigns:
Average CPI by category — ASA vs GAC:
- Casual games: ASA $1.24 / GAC $0.63 (GAC ~50% cheaper)
- Simulation games: ASA $1.50 / GAC $0.59 (GAC dramatically cheaper)
- Mid-core games: ASA $2.50 / GAC $2.00
- Education: ASA $1.40 / GAC $1.20
- Photo & Video: ASA $2.50 / GAC $1.80
- Productivity / Tools: ASA $3.50 / GAC $2.20
- Health & Fitness: ASA $4.00 / GAC $2.80
- Lifestyle: ASA $3.00 / GAC $2.00
- Finance / Fintech: ASA $8.44 / GAC $4.13 (down from $7.03 recently)
- Music & Entertainment: ASA $2.90 / GAC $1.90
- Overall average: ASA $1.80 / GAC $1.29
The pattern is consistent: GAC produces 30–50% lower CPI across categories. This is real. But it doesn't mean GAC is the better channel — it means GAC reaches lower-intent users at scale, and a portion of those installs never convert to revenue.
Geographic variation in 2026:
- US/UK/Canada/Australia: Most expensive ASA markets. GAC also higher here but the gap narrows.
- APAC shopping iOS: GAC dropped to $0.90 CPI in 2026 — extremely cost-efficient.
- Brazil iOS: GAC averages $0.22 CPI — emerging market efficiency.
- European Finance: ASA dropped from $7.37 to $4.75; GAC similarly compressed.
- Non-English geos: ASA tends to run materially cheaper because competition is thinner.
Geography is one of the most reliable ways to compress CPI on either platform. If your app is global, run separate campaigns per region rather than blended geo targeting.
The CPI trap: low CPI ≠ high ROAS
The single most important insight in cross-platform paid acquisition in 2026: quality-adjusted CPI matters more than raw CPI. The concrete math:
Paying $5 CPI on Apple Search Ads for a user with $50 LTV produces $45 net contribution per install.
Paying $3 CPI on Google App Campaigns for a user with $8 LTV produces $5 net contribution per install.
The "cheaper" install is 9x less profitable per dollar invested. CPI alone tells you what you're paying for installs; ROAS tells you whether those installs become revenue.
Why this gap exists
- ASA captures bottom-funnel intent. Users searching the App Store have already decided they want an app in your category. They convert at 67.2% tap-to-install rate (industry average for ASA in 2026), and they retain at 1.4x the rate of off-platform paid users.
- GAC captures mid-funnel and top-funnel reach. Users seeing a YouTube ad for your app may not be actively searching for an app at all. Conversion rates are lower per impression, and a portion of installs never engage post-install.
For premium-positioned subscription apps with strong LTV, ASA's higher CPI usually produces better ROAS. For broad consumer apps competing on volume, GAC's lower CPI scales beyond what App Store search supports. Neither is universally better.
Where Apple Search Ads structurally wins
Despite GAC's lower CPI, ASA is the right choice in specific situations:
- You're iOS-first or iOS-only. ASA is iOS-only by design. For a single-platform iOS app, ASA is the highest-intent paid channel available.
- You have established search demand. Users searching for keywords in your category translates directly to ASA performance. Categories with strong search intent (utilities, productivity, fitness) benefit most.
- You have strong ASO. ASA conversion rate is gated by your App Store listing quality. Apps with 4.0+ ratings, polished screenshots, and relevant metadata convert at 70%+ on ASA. Apps with weaker listings underperform.
- Your LTV is high enough to support a $2–$5 CPI. Subscription apps with $20+ LTV per install can sustain ASA's higher CPI profitably.
- You want immediate measurement. ASA reporting is real-time and deterministic. Daily optimization is feasible. You can act on signals within 24 hours.
- You're running branded defense. Bidding on your own brand name is the cheapest paid placement in mobile — often $0.30–$1.00 CPI. Skipping this is leaving money on the table for competitors to take.
- You want keyword-level transparency. ASA shows you exactly which keywords drive installs. GAC's black-box ML doesn't expose that granularity.
Where Google App Campaigns structurally wins
Equally clear situations where GAC is the better choice:
- You're shipping on Android. ASA is iOS-only. GAC is the dominant paid acquisition channel on Android, with no equivalent rival at scale.
- You need to scale beyond search demand. ASA is capped by App Store search volume in your category. For high-volume targets (100K+ installs/month), GAC's broader reach across YouTube, Display, and Discover is essential.
- You have strong video creative. GAC's YouTube and Display placements reward video. If you've invested in a 15–30 second app preview or feature demo, GAC distributes it where it performs best.
- You're targeting emerging markets. APAC, India, Southeast Asia, Latin America — Android dominates and GAC CPI is dramatically lower (Brazil $0.22 iOS, APAC $0.90).
- You're a cross-platform app. Running both iOS and Android, GAC provides a single management surface for both. ASA handles iOS only.
- Your business model supports high volume at modest LTV. Ad-monetized free apps, casual games, and freemium tools often need GAC's volume to be sustainable.
- You want ROAS-based bidding at scale. GAC's tCPA and tROAS bidding strategies optimize for downstream value once you've accumulated enough conversion data (200–500 deep events per week per campaign).
The honest comparison: head to head
Line by line, what each platform offers:
- Reach: ASA — App Store only. GAC — App Store + Google Search + YouTube + Display + Discover + Gmail. GAC wins on reach.
- Intent quality: ASA — high (active search). GAC — variable (some placements high, others low). ASA wins on average intent.
- Conversion rate (tap to install): ASA averages 67.2%. GAC varies widely by placement — 5–25% on Display/YouTube, higher on Google Play. ASA wins on per-impression conversion.
- Tap-through rate (TTR): ASA averages 11.4%. GAC varies. ASA wins on engagement per impression.
- CPI (average): ASA $1.80. GAC $1.29. GAC wins on raw CPI.
- Retention (D7, D30): ASA users retain 1.4x better than off-platform paid users. GAC users vary; depends on placement mix. ASA wins on retention.
- LTV per install: ASA higher on average for premium apps. GAC variable. ASA wins on premium-positioned apps; GAC wins on volume-driven apps.
- Attribution speed: ASA — real-time, deterministic. GAC iOS — SKAdNetwork (24–72 hr delay). GAC Android — near-real-time. ASA wins on iOS reporting speed.
- Optimization cadence: ASA tune daily. GAC iOS tune weekly. GAC Android tune daily-to-weekly. ASA wins on iteration speed.
- Creative requirements: ASA uses your existing store metadata + Custom Product Pages. GAC requires text headlines, images, video assets. GAC requires more upfront creative work.
- Volume of conversion events needed to optimize: ASA needs 50–100 deep events per week per campaign. GAC needs 200–500 deep events per week to reliably optimize beyond Install. ASA scales smaller campaigns better.
- Setup complexity: ASA Advanced is keyword-driven, structured. GAC is automated but requires creative production. Both are operationally serious.
- Geographic coverage: Both global. GAC has slight edge on emerging markets due to Android dominance.
The 60/40 allocation framework
Most mature 2026 acquisition strategies allocate 60–70% to ASA and 30–40% to GAC. The reasoning:
- ASA is your efficiency anchor. Higher quality per dollar invested. Set the baseline LTV and ROAS expectations here.
- GAC is your scale lever. Once ASA is producing positive ROAS, GAC adds reach beyond what search demand supports. The 30–40% allocation is the volume budget — you're paying more for less-targeted users in exchange for growth that exceeds your category's search ceiling.
- Rebalance quarterly. If GAC ROAS catches up to ASA's at scale (it sometimes does with mature creative and data infrastructure), shift more budget there. If ASA's branded and category campaigns become saturated, shift earlier-funnel budget to GAC.
- Don't blend them into one channel. Each needs its own MMP attribution view, its own bid strategy, and its own creative cycle. Treating them as fungible buckets produces worse results than running them as distinct portfolios.
For indie developers starting paid acquisition, the practical sequence:
- Week 1–4: ASA only. Run branded defense + 1 category discovery campaign. Budget $20–$50/day. Learn what works.
- Month 2: If ASA is positive ROAS, add GAC at half your ASA budget. Run iOS and Android in separate campaigns.
- Month 3+: Calculate ROAS on both. Rebalance toward whichever has stronger 30-day cohort performance.
- Month 6+: Consider Custom Product Pages on ASA and expanded GAC creative variants.
The operational mistakes that destroy returns on either platform
Patterns that consistently burn indie acquisition budget:
- Mixing ASA and GAC budgets in one mental bucket. They have different intent profiles, different LTV signals, and different optimization cadences. Track them separately.
- Letting GAC iOS autopilot without guardrails. GAC iOS needs tCPA limits and budget caps. Otherwise the algorithm chases volume at any cost.
- Skipping branded defense on ASA. Competitors bid on your brand name. Your own brand is the cheapest install in mobile. Always claim it.
- Tuning GAC iOS daily. SKAdNetwork delay means daily signal is noise. Tune weekly. Tuning daily destroys learning data.
- Killing campaigns too early. ASA subscription apps need 60–90 days for ROAS confirmation. GAC needs equal patience. Killing at 14–21 days produces uniformly bad conclusions.
- Optimizing GAC on Install alone. GAC's tCPA-on-Activation outperforms tCPI once you have 200–500 events/week per campaign. Until then, optimize on Install to avoid premature optimization on thin data.
- Ignoring conversion rate signal on both platforms. Both reward high App Store / Play Store conversion rate with lower CPI. ASO improvements compound into paid efficiency on both channels.
- Running ASA Basic when you have operator capacity. Basic is a placeholder for very early stage. It caps performance at modest levels. Move to Advanced as soon as you have 14 days of data.
- Skipping Custom Product Pages on ASA. A serious ASA program runs 3–8 CPPs against distinct audiences. Generic single page is leaving 15–40% CR lift unclaimed.
- Not running an MMP on either platform. Adjust, AppsFlyer, Branch, or Singular gives you downstream event signal flowing back to ASA and GAC bidding. Without it, you're optimizing on installs while flying blind on revenue.
When NOT to run either platform
Honest cases where paid acquisition isn't the right next step:
- You don't know your LTV. Can't calculate target CPI without it. Get 30 days of monetization data first.
- Your app is under 4.0 stars. Conversion rate from tap to install collapses at low ratings. Fix ratings first — see our rating optimization guide.
- Your monetization is broken. If your free-to-paid conversion is under 1% and your retention is poor, no CPI is low enough to be profitable. Fix the product first.
- Your minimum sustainable CPI is below category average. Free apps with $0.30 LTV can't sustain even GAC's $0.63 casual game CPI. Improve monetization before considering paid.
- You haven't claimed organic ASO opportunity yet. Paid amplifies what you have. If organic ASO is unfilled (weak metadata, generic screenshots, unrated app), fix that first — paid will perform better once organic is solid.
For the organic ASO foundations that make paid acquisition work, our 100-character keyword guide, screenshots that convert guide, and rating optimization guide cover the foundations.
Frequently asked questions
Is GAC really 30–50% cheaper than ASA?
On raw CPI, yes — across most categories. But the cheaper installs include lower-intent users. ROAS-adjusted, ASA often outperforms GAC for premium-positioned subscription apps. Optimize for ROAS, not CPI alone.
Does ASA work for Android?
No. ASA is iOS-only. For Android paid acquisition, GAC is the dominant channel. There's no iOS-Android equivalent of ASA.
What's the minimum budget to test both?
$30/day on ASA for 30 days = $900. $30/day on GAC for 30 days = $900. $1,800 total minimum to test both with statistical meaning. Less than this and the data is too noisy to act on.
Can I run GAC without an MMP?
On Android, yes — Google Play attribution is sufficient. On iOS, you should use an MMP (Adjust, AppsFlyer, Branch, or Singular). SKAdNetwork data alone limits your optimization capability.
How long until each platform produces positive ROAS?
ASA: 60–90 days for subscription apps with 7-day trials. 30 days for one-time purchases. GAC: similar timelines, but iOS GAC needs longer because SKAdNetwork delays cohort data accumulation.
Which platform should I start with?
iOS-first apps: ASA. Android-first apps: GAC. Cross-platform apps with iOS strength: ASA first, GAC after 2–4 weeks of stable ASA data. Cross-platform apps with Android strength: GAC first, ASA after.
What's the typical allocation for mature mobile apps?
60–70% ASA / 30–40% GAC is the most common mature allocation in 2026. Quarterly rebalancing based on ROAS performance and growth goals.
Can I optimize both platforms toward downstream events (trial start, purchase)?
Yes. Both support deep-event optimization once you have enough volume: ASA needs 50–100 events/week per campaign, GAC needs 200–500. Below these thresholds, optimize on Install or Activation only.
How do creative requirements differ?
ASA uses your existing store listing — metadata, screenshots, optionally Custom Product Pages. No separate ad creative required. GAC requires text headlines, images, and ideally video. GAC creative production is significantly more work upfront.
Will ASA expand beyond just iOS?
Currently no. As of 2026, ASA is exclusively iOS. Apple has expanded ASA placements within the App Store (Today tab, product pages, Search tab) but hasn't moved off-platform.
The bottom line
Apple Search Ads and Google App Campaigns aren't competitors for your budget — they're complementary roles in your acquisition portfolio. ASA delivers higher-intent, higher-quality, higher-LTV users at higher CPI. GAC delivers scale, volume, and lower CPI across Google's entire ecosystem. The mature 2026 allocation is 60–70% ASA / 30–40% GAC for most iOS-first apps, with rebalancing based on quarterly ROAS performance. For Android-first apps, GAC carries the majority and ASA isn't applicable. The wrong question is "which platform is better" — the right question is "what role does each platform play in my acquisition portfolio." Get that answer right and paid acquisition becomes a margin multiplier; get it wrong and you'll burn $300/day chasing the wrong metric.
For the foundational platform-specific deep dive, our Apple Search Ads ROI guide covers ASA campaign structure, bid framework, and Custom Product Pages in detail. For the rest of the acquisition picture: your subscription pricing determines the LTV that sets your maximum sustainable CPI on both platforms. Your screenshots and ratings determine the conversion rate that drives down CPI on both platforms. Paid acquisition is a multiplier on strong fundamentals — get the fundamentals right first, then scale with ASA and GAC together.
Related posts

Make your App Store screenshots free
LaunchShots is a free, in-browser screenshot maker. No signup, no watermark.
Open the app →
Comments (0)